
 Tweet
Tweet
Originally posted by GGG Gloveking
View Post
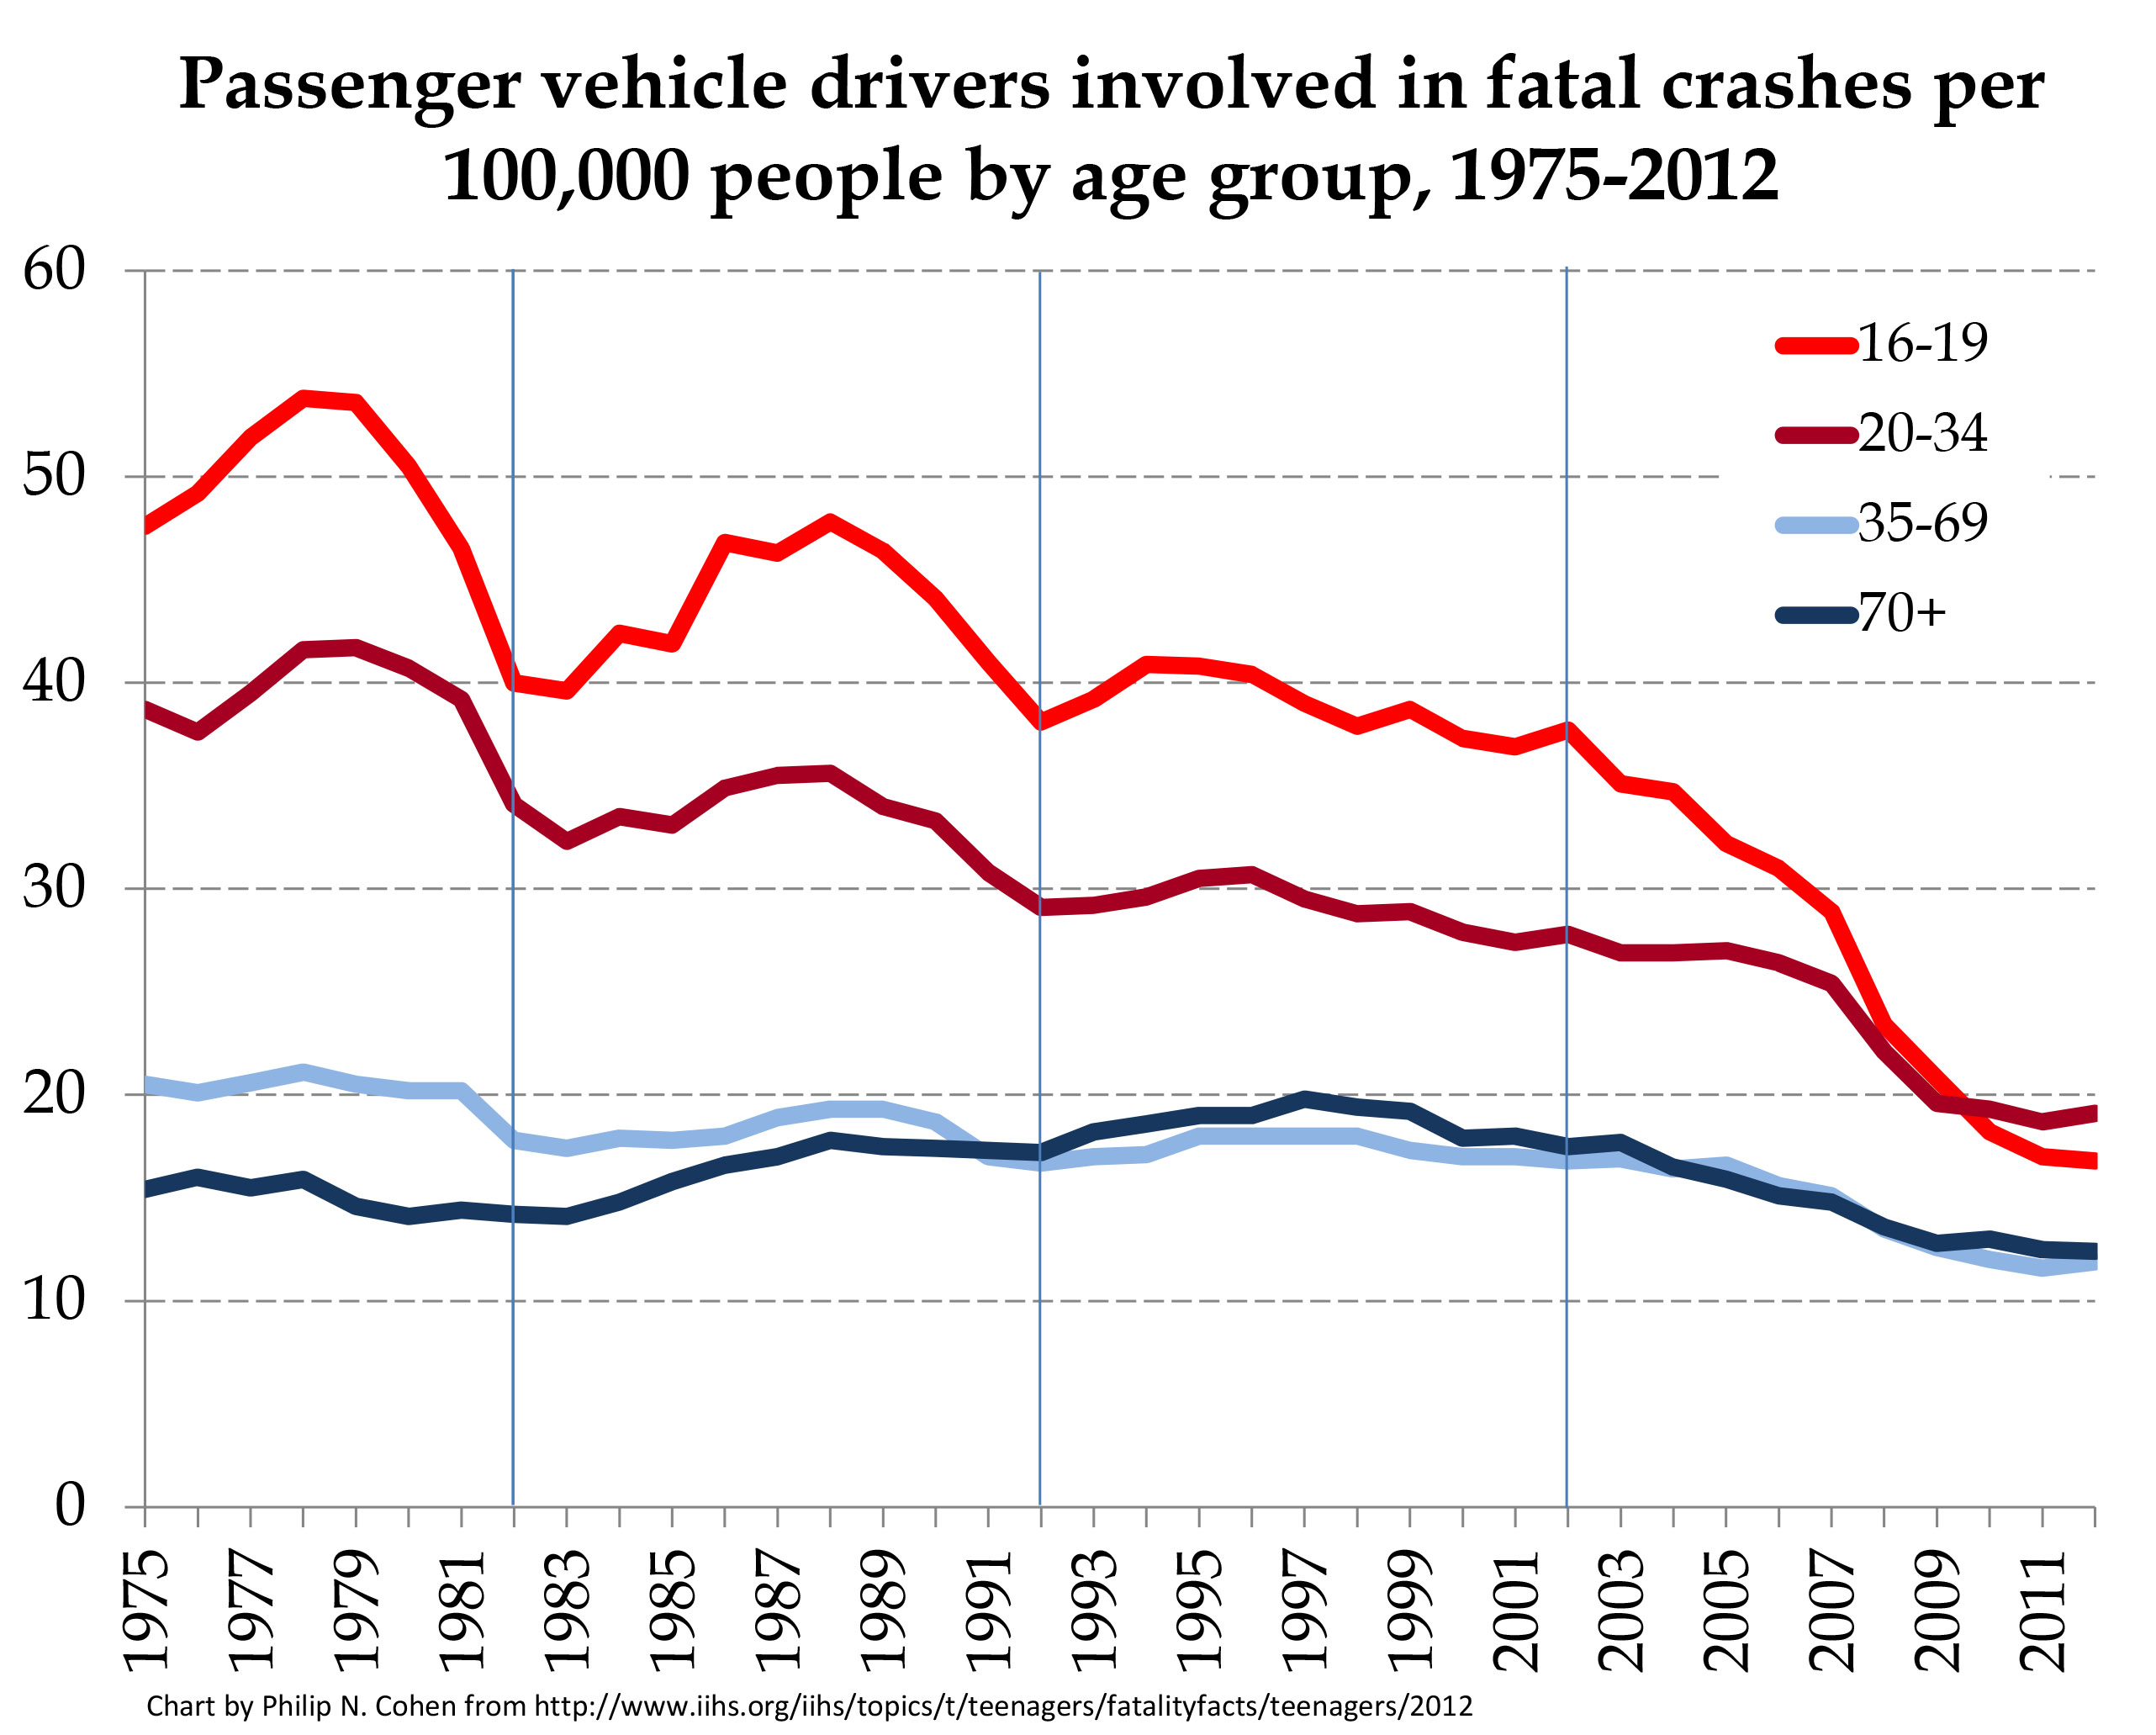
Again, my graph that you posted above was meant to compare decreases over time between age groups and supplemented my graph on the decrease in percentage of adolescents over time. However, it too shows a huge trough and then a huge spike right after 1984 and then went down again but my other graph shows that that deaths are on the rise again in 2000s. Again, I attribute the spike to the government's MLDA insinuating that drinking makes you grown up. But my original premise was that your prohibition ideas and government backup was shatty
Wrong again, my argument is about doing laws right without hypocritical lobbying. There is a highly defined profile for these cshool shooters but the government refuses to look at it. Likewise, if the government really wanted to reduce alcohol related deaths they would stop pandering to their shltty brewery lobbies and let people make and grow their own, which would be a huge psychological factor. If You really want to lower traffic deaths, then raise the driving age but comparing these young drinkers to satanic shool shooters is ludicrous. Oo but the car lobby


Comment